
11 projects
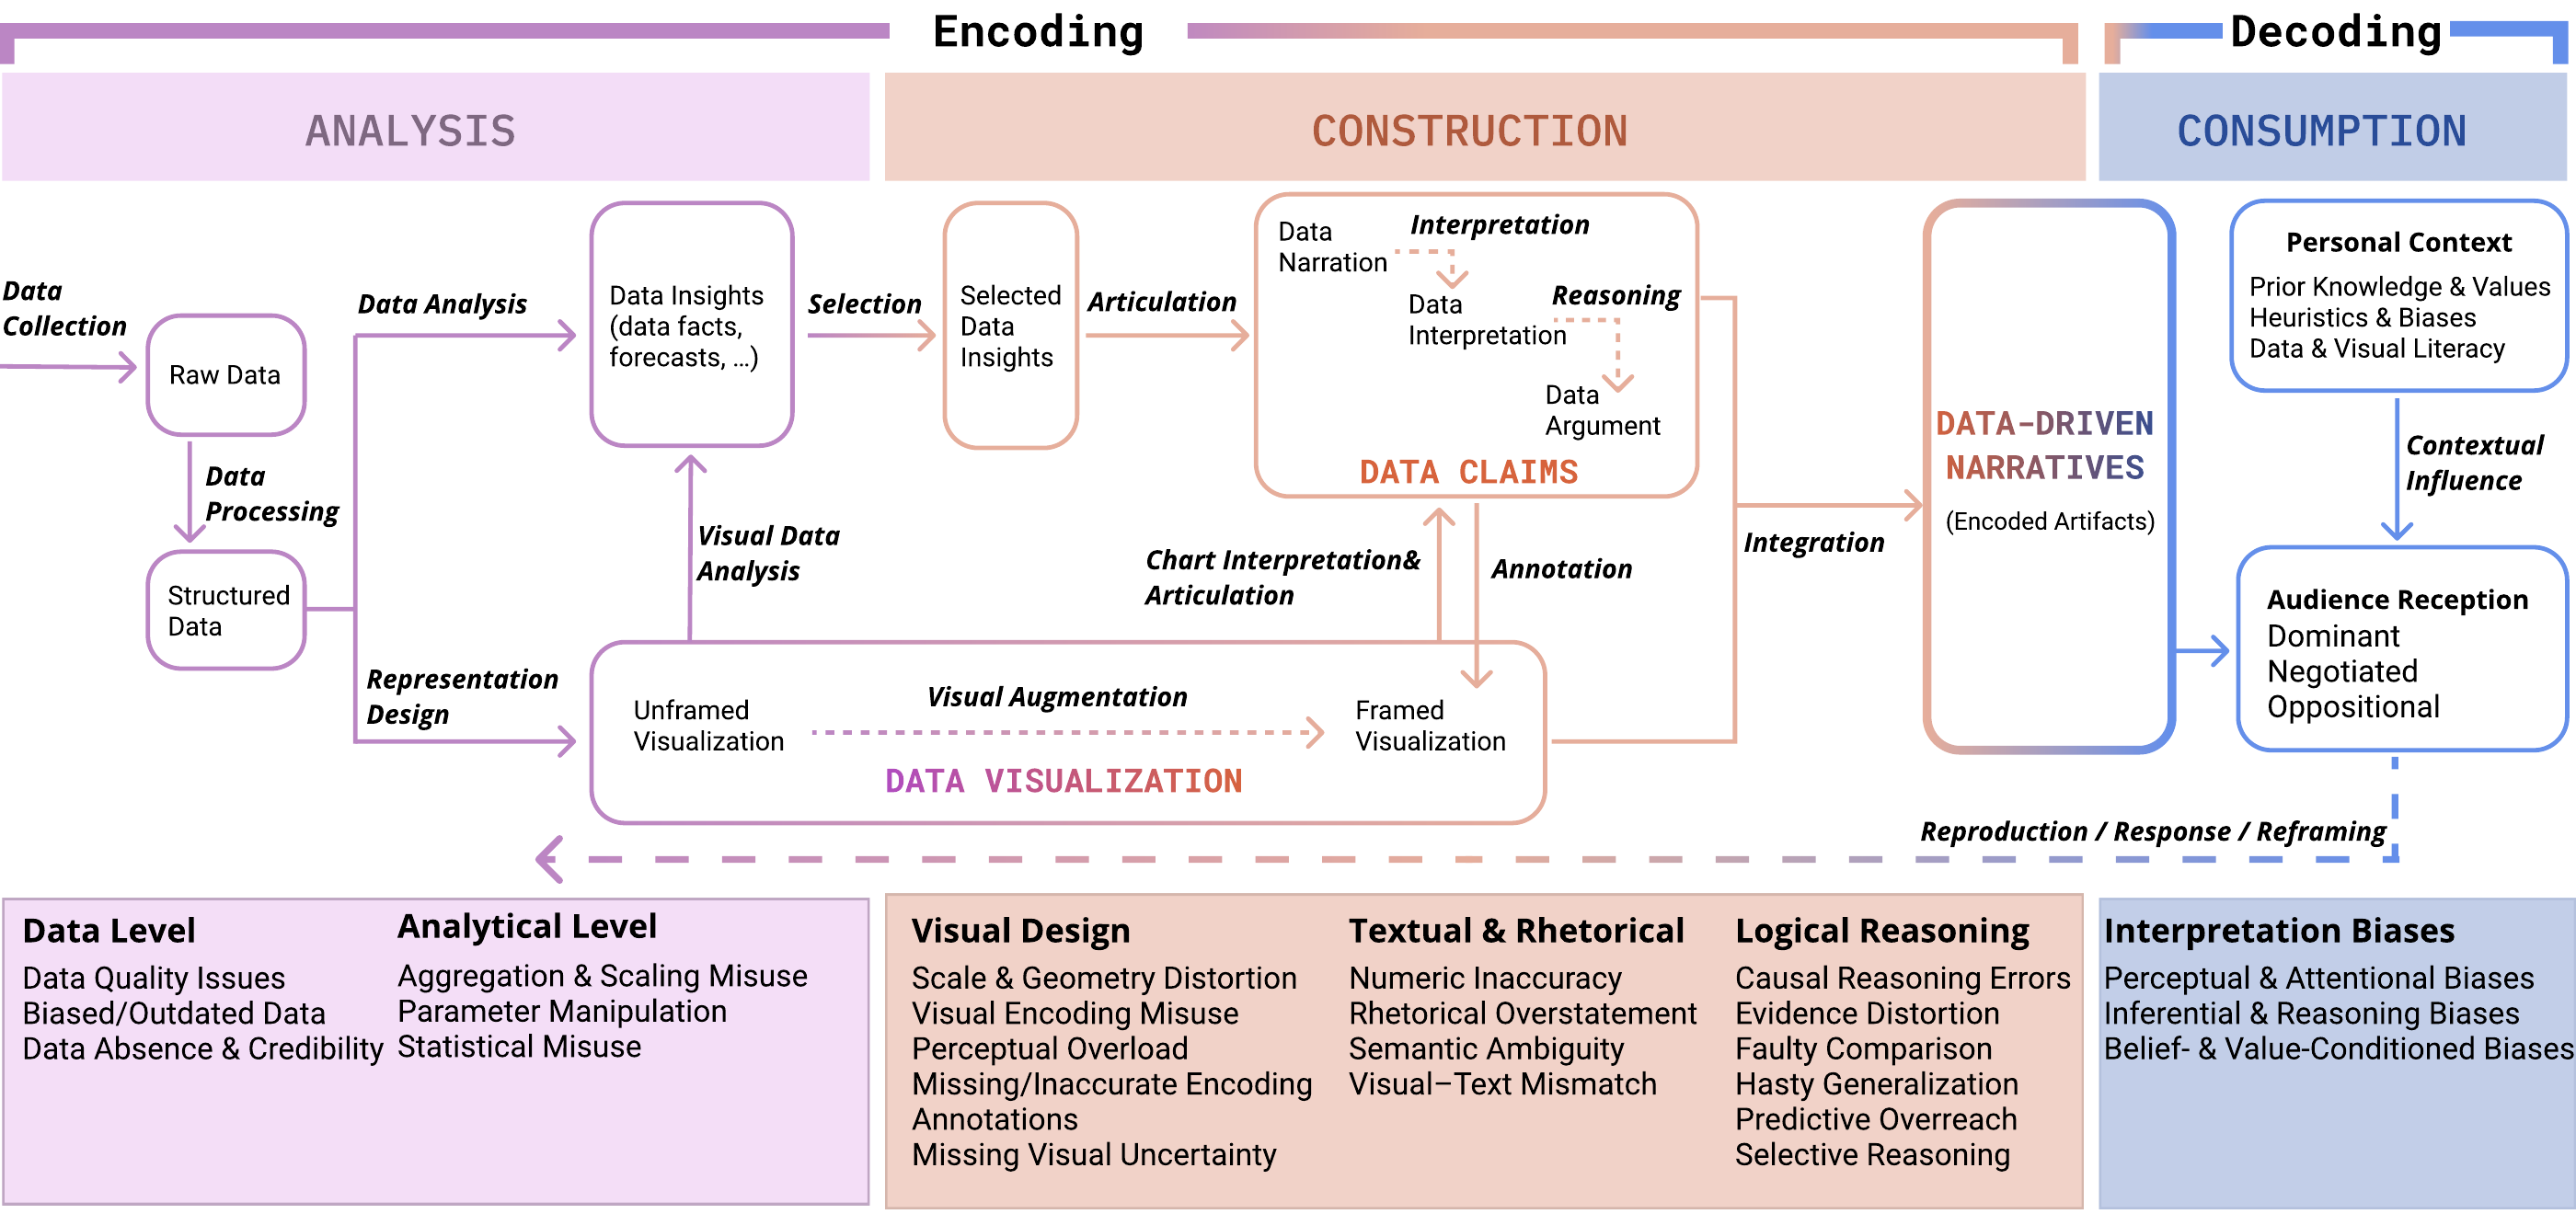
Tracing how data narratives break down across analysis, construction, and audience interpretation.

A bidirectional authoring tool connecting text and visuals for data storytelling.
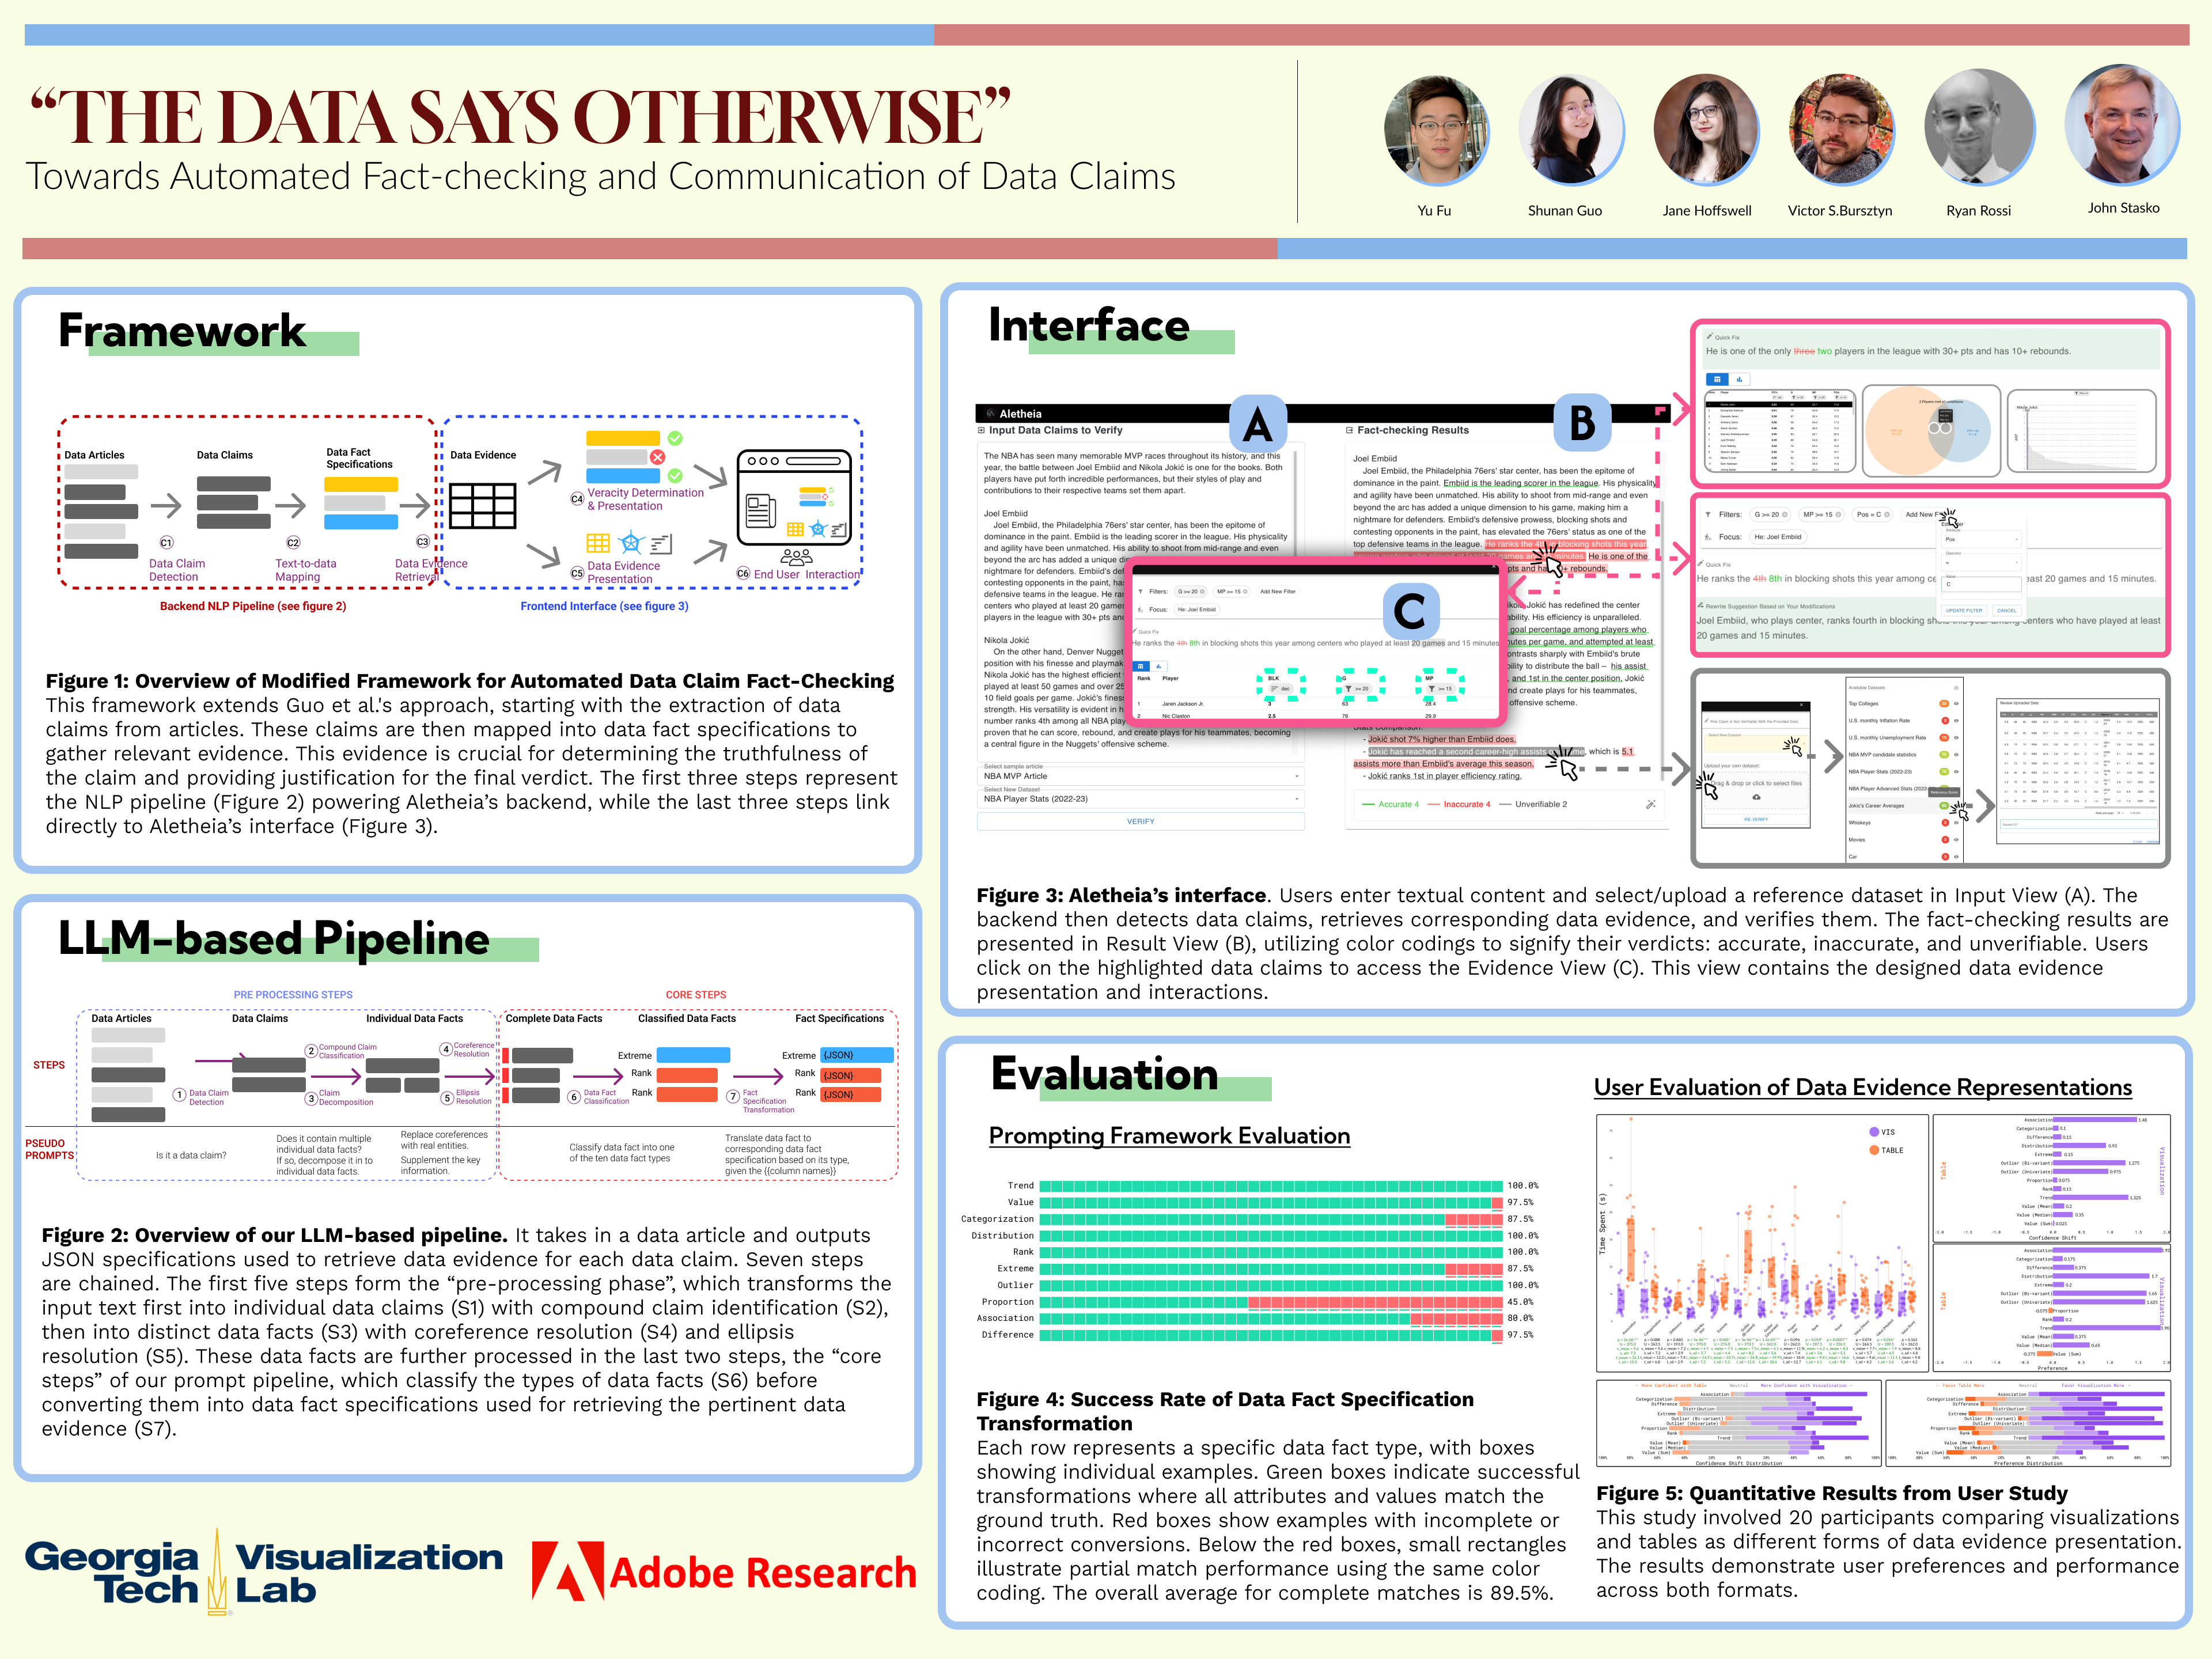
An automated fact-checking system for verifying and communicating data-driven claims.
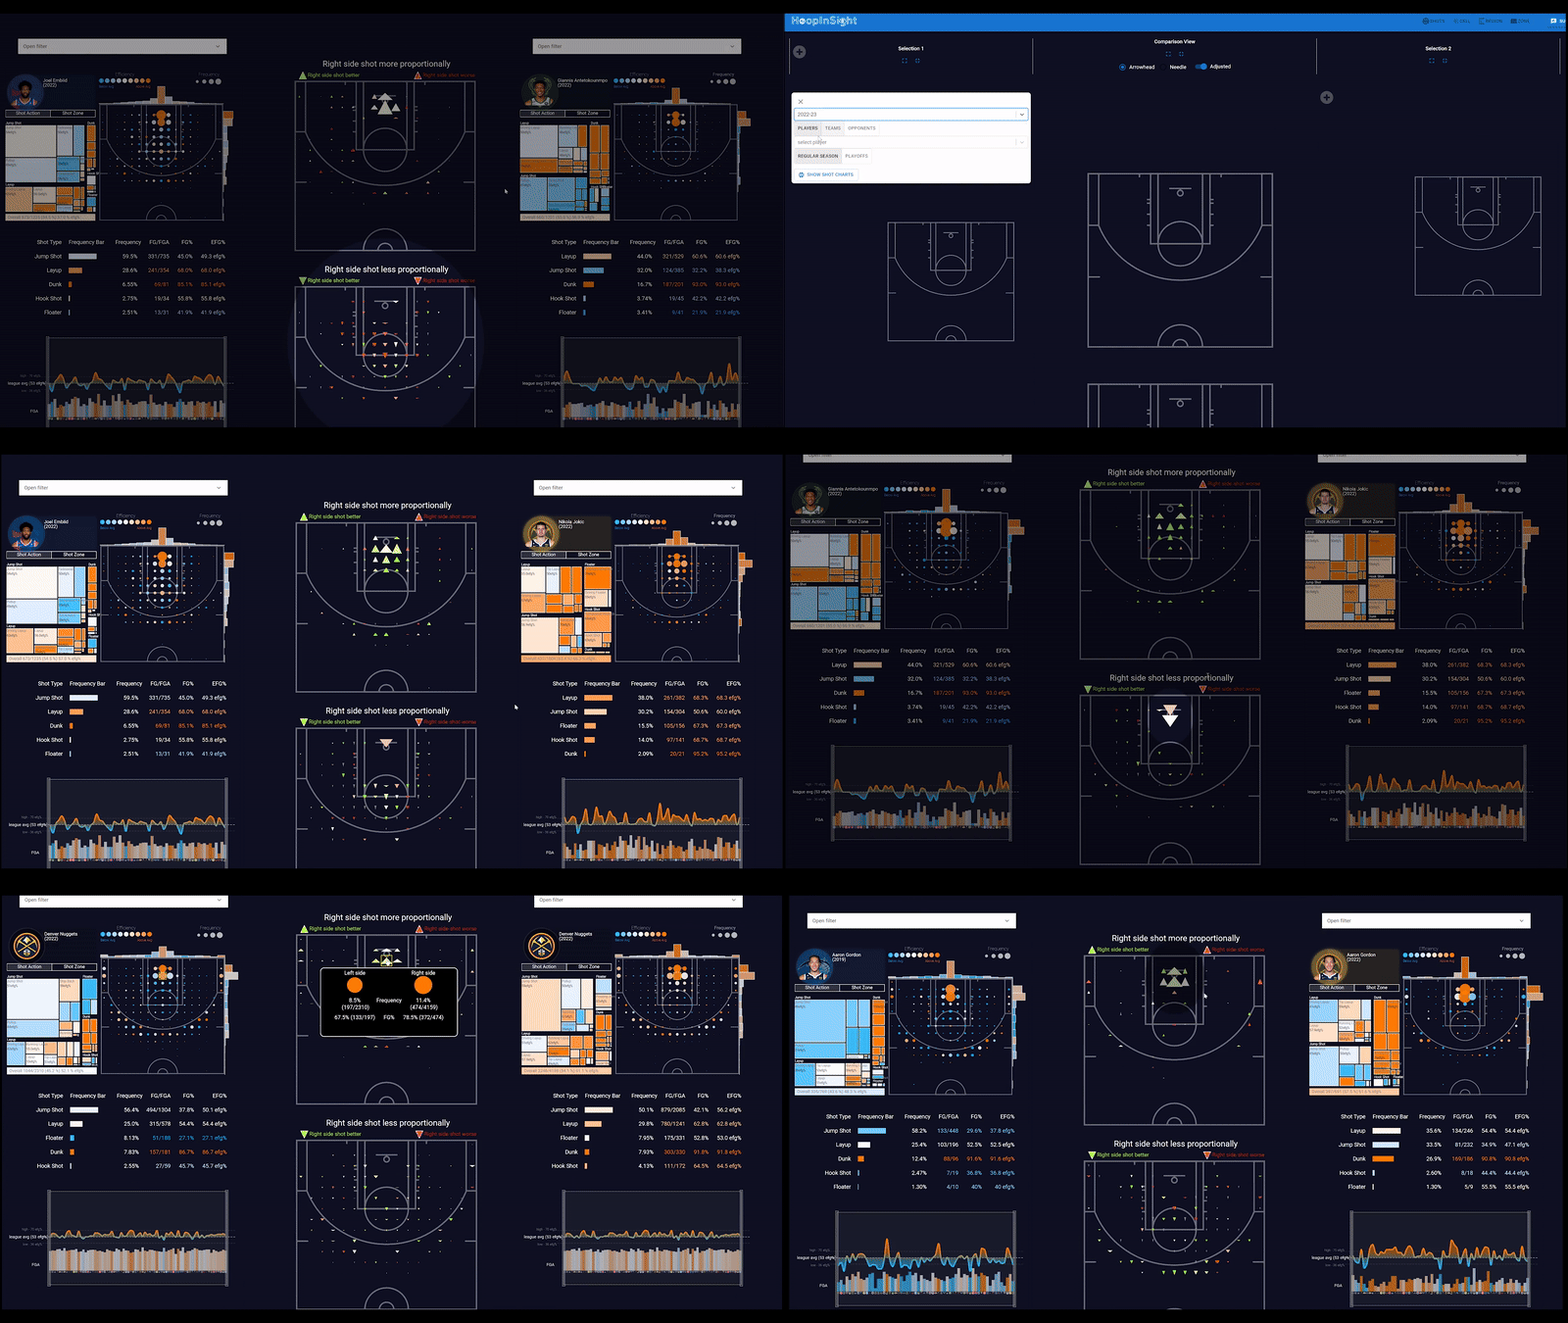
Visual analytics for analyzing and comparing basketball shooting performance.
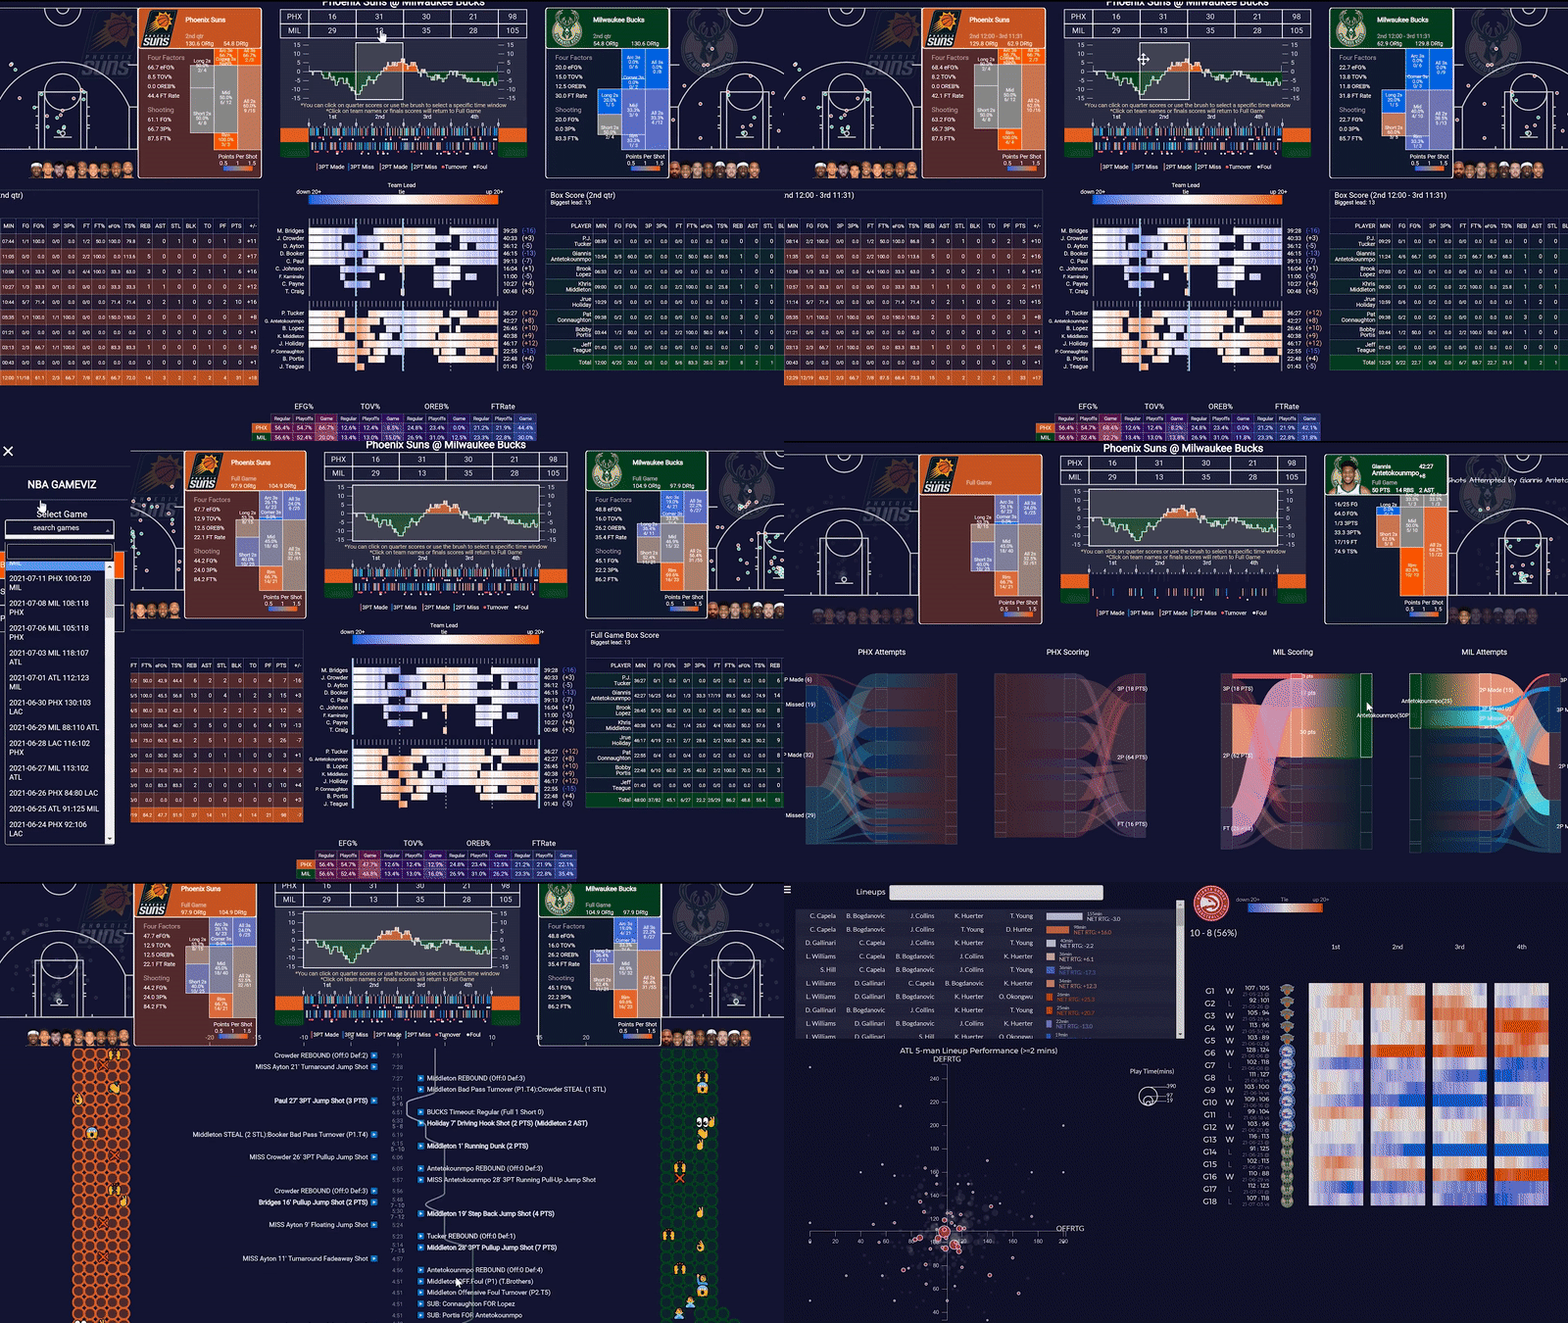
Interactive visualization of NBA game data and advanced statistics.
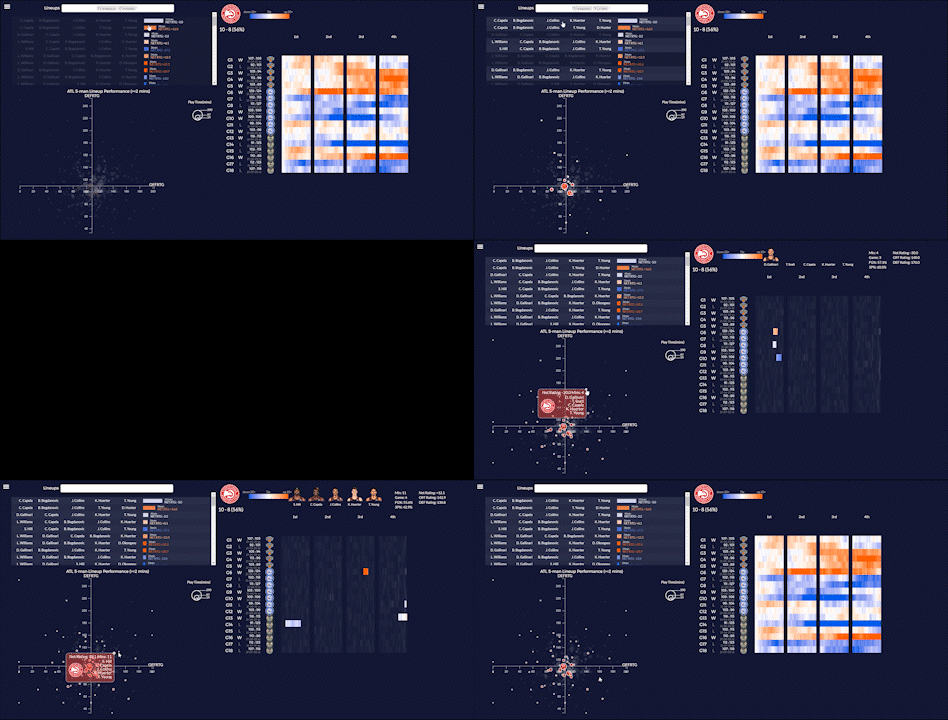
Visualizing NBA team lineup performances.
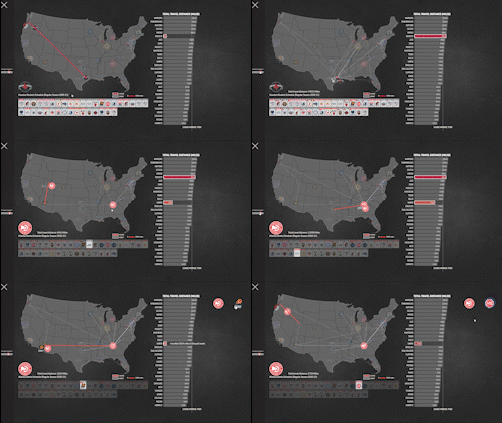
A just-for-fun animated map of NBA teams' travel across a season.
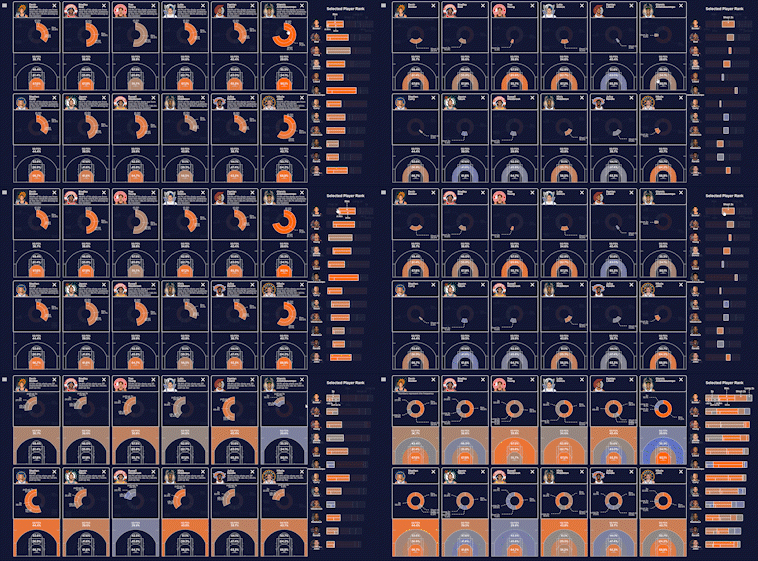
Participatory design project with ShotQuality to visualize shot data.
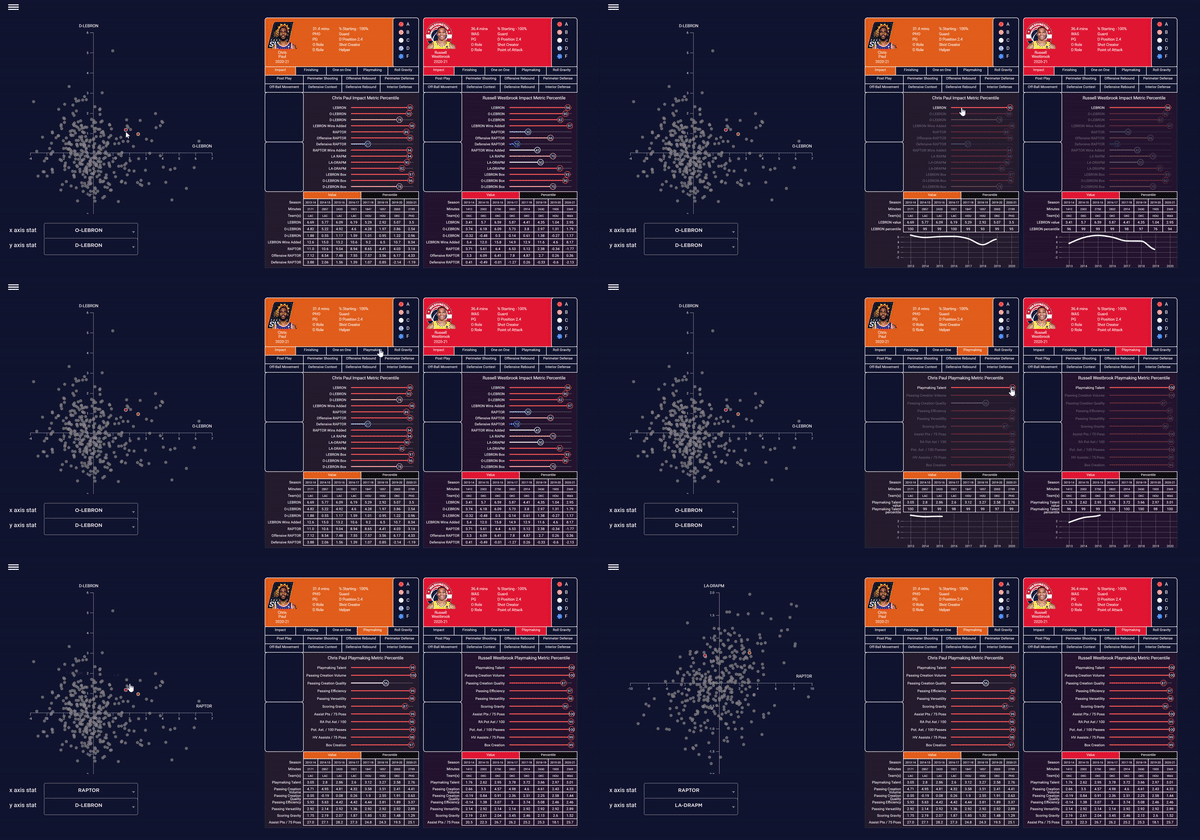
Prototype player profile visualization with BBallIndex advanced metrics.
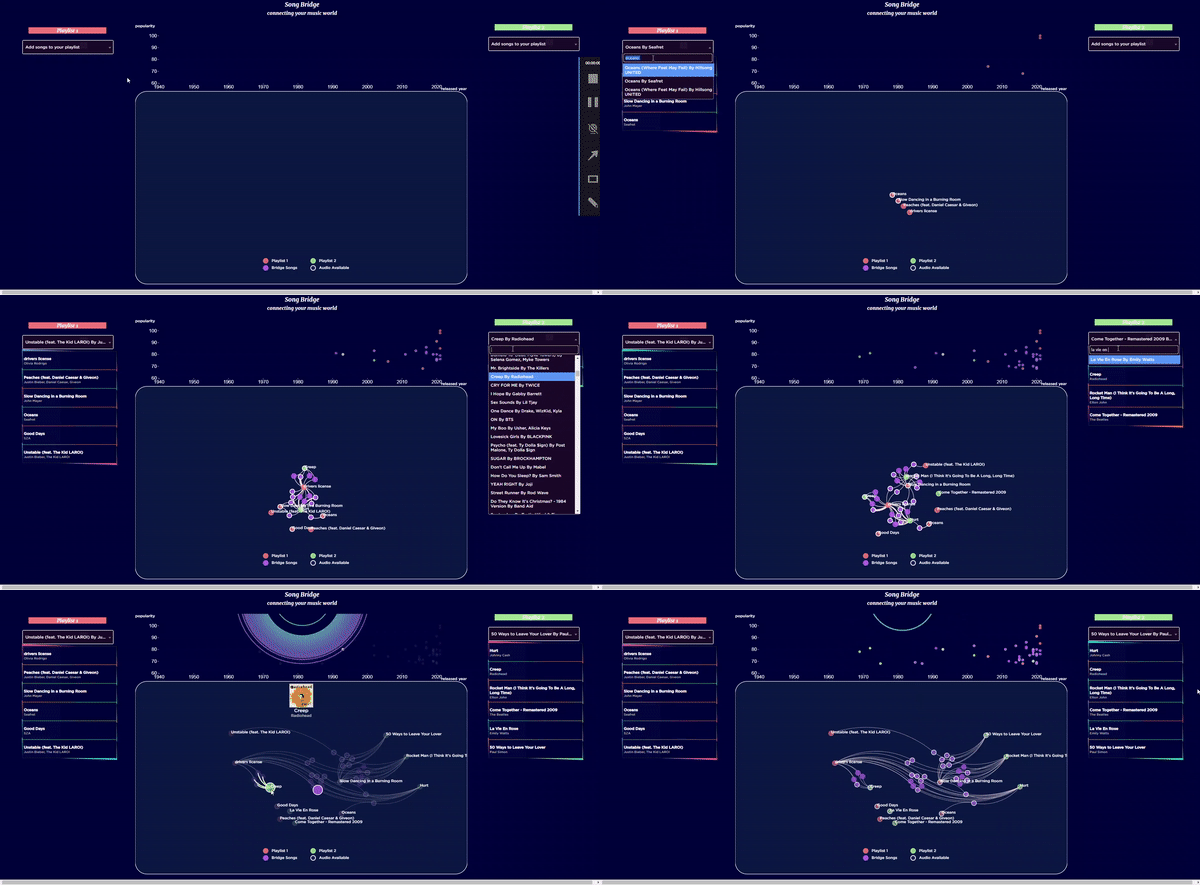
Comparing playlists and visualizing connections between them.
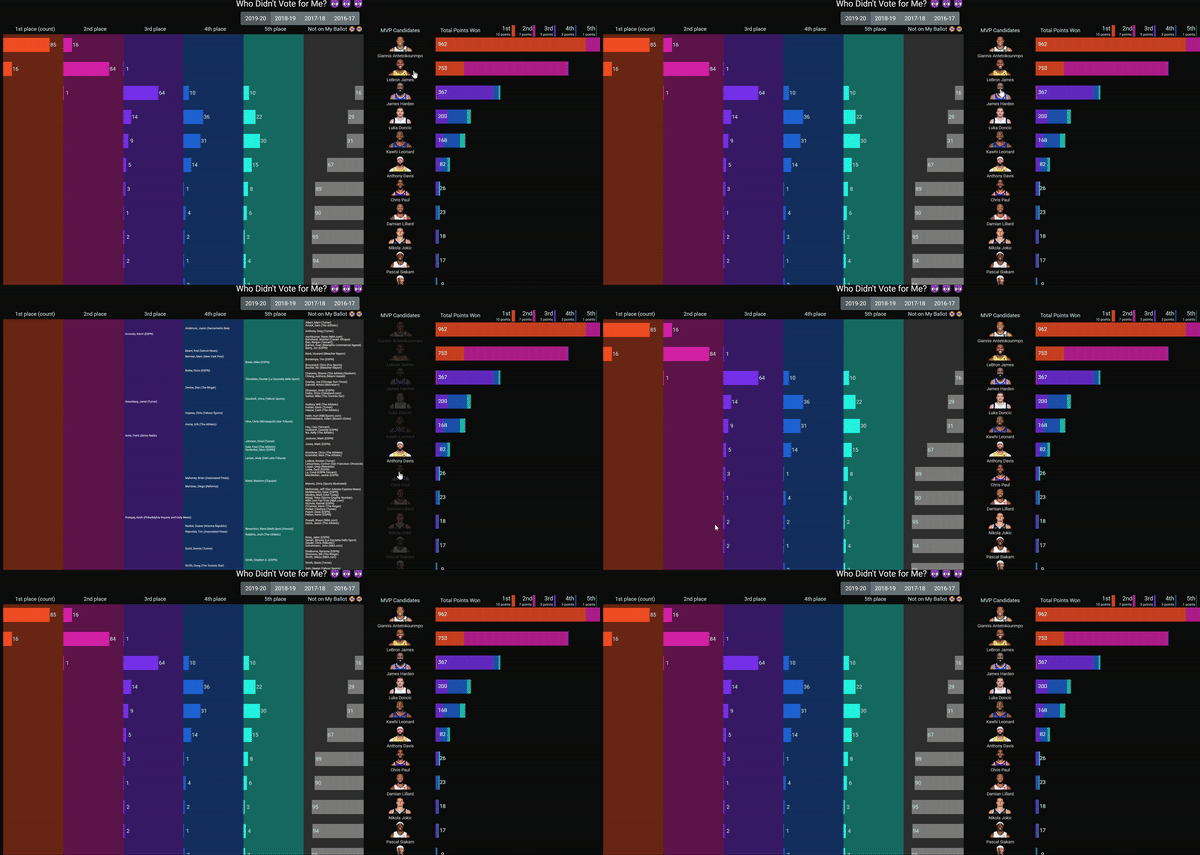
Interactive visualization of NBA MVP voting results.